In statistics, there are many elements to consider if someone wants to write questionnaires to obtain high-quality data. Researchers want to make sure that their measures can both be applied consistently as well as accurately reflect the objectives they seek to measure. Therefore, they strive to obtain a high amount of reliability and validity in their studies.
What does that really mean and why does it matter?
Validity is concerned with the accuracy of the researcher's measurements. This is often discussed in the context of sample representativeness but it is also affected by the preciseness of the questions that measure what it's supposed to be measuring.
Researchers strive for high validity in two forms: internal and external validity. Internal validity looks into whether the questions being asked can appropriately measure the outcome that the researchers intend to study. Meanwhile, external validity refers to the extent by which the results can be generalized to the target population the survey sample is representing
Reliability, on the other hand, is concerned with the consistency of the measure or the degree to which the questions used in the questionnaire elicit the same type of information each time they are used under the same conditions. For example, a measure is reliable if it yields consistent scores across multiple administrations.
Similarly, there are two types of reliability: internal and external reliability. Internal reliability assesses the consistency across items on the test- the extent to which a measure is consistent within itself. External reliability refers to the extent to which a measure varies from one use to another.
This can be measured using a variety of methods, such as internal consistency, equivalent forms, and test-retest approaches. Internal reliability forms include an internal consistency estimate of reliability, in which individuals are administered a measure with multiple parts once. External reliability includes giving the same measure twice or a slightly different measure each time for two occasions.
One helpful metaphor is that of a target. We can imagine that a study was conducted on a group of people, in which each person is represented as a single shot at the target. If the measure lacks validity but has reliability then it is consistent but wrong. Likewise, if a measure has validity but lacks reliability then it is accurate but only in a singular case - and is therefore not consistent when applied in a general context.

Now you might be wondering how I took both of these in consideration in my study.
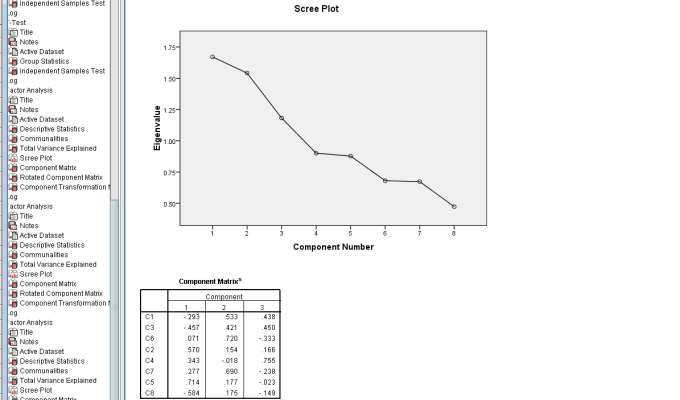
Earlier, I came across a study by Larsen and Leroux (1982) which stated that item analysis tests, compared to factor analysis tests, proved to be superior for reliability and validity estimates.
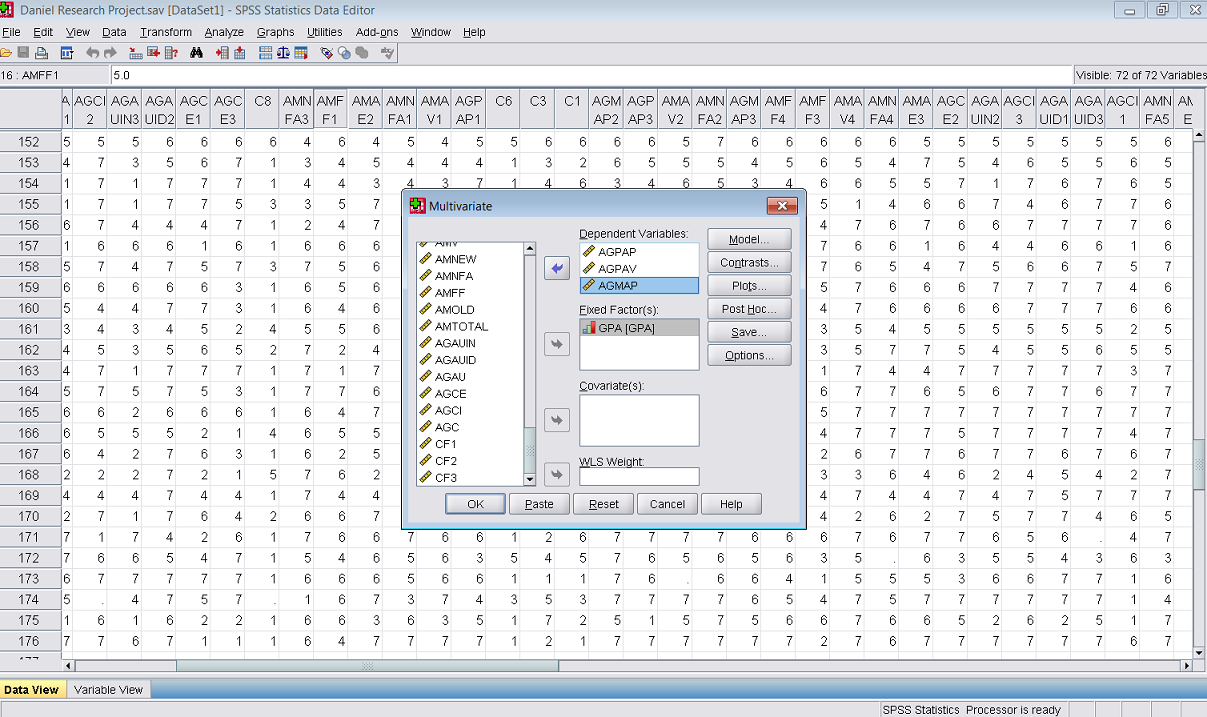
As a result, when I first did my factor analysis two weeks ago, I took into account the importance of reliability and validity and computed item analyses for all my variable scales. This meant I could get an accurate measure of my questionnaire's internal consistency providing me with good results.
Overall, it is essential for researchers to strive for a high level of validity and reliability so that they can collect objective and high-quality data while fulfilling their goals in conducting the study.
Earlier, I came across a study by Larsen and Leroux (1982) which stated that item analysis tests, compared to factor analysis tests, proved to be superior for reliability and validity estimates.
As a result, when I first did my factor analysis two weeks ago, I took into account the importance of reliability and validity and computed item analyses for all my variable scales. This meant I could get an accurate measure of my questionnaire's internal consistency providing me with good results.
Overall, it is essential for researchers to strive for a high level of validity and reliability so that they can collect objective and high-quality data while fulfilling their goals in conducting the study.